0%
Chat

ECB Financial Stability Risk Dashboard—2025

Euro Area Systemic Risk Overview

May 2025 | European Central Bank

Executive Summary

The ECB’s Financial Stability Review (Nov 2024) highlights persistent macro-financial and geopolitical uncertainty, with risks shifting from inflation to growth. While euro area banks remain resilient, vulnerabilities are rising in sovereign, corporate, and non-bank sectors. Market volatility and policy uncertainty remain elevated.

Key Risk #1

Macro-financial/geopolitical shocks & market volatility

Key Risk #2

Sovereign and corporate debt sustainability

Key Risk #3

Non-bank financial sector liquidity & leverage

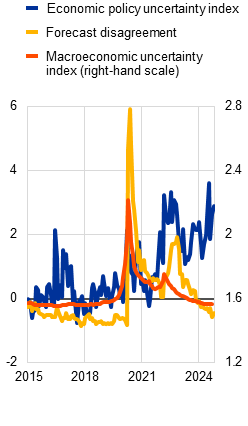
Macro-Financial & Market Environment

Uncertainty remains high due to geopolitical tensions and shifting monetary policy. Market volatility has increased, with sharp corrections in equity and bond markets. Policy rates remain elevated, and central bank balance sheets are gradually normalizing.

Market Volatility

Source: Global Market Research Institute Volatility Index (0-100 scale where higher values indicate more volatility)
Market Volatility: Financial markets have experienced increased volatility amid shifting monetary policy and geopolitical tensions. Equity and bond markets have seen sharp corrections, highlighting the sensitivity of asset prices to macro-financial shocks.

Global Interest Rate Environment

Source: Central banks, Bloomberg, GFMI estimates as of January 2025
Interest Rate Environment: Policy rates remain elevated as central banks continue to address inflationary pressures. Higher rates have increased funding costs for households, corporates, and sovereigns, impacting debt sustainability and credit conditions.

Central Bank Balance Sheets

In trillions of USD
Source: Central bank balance sheet data, Q4 2024
Central Bank Balance Sheets: Central bank balance sheets are gradually normalizing after years of expansionary policy. The reduction in asset holdings may affect market liquidity and asset prices, requiring careful monitoring.

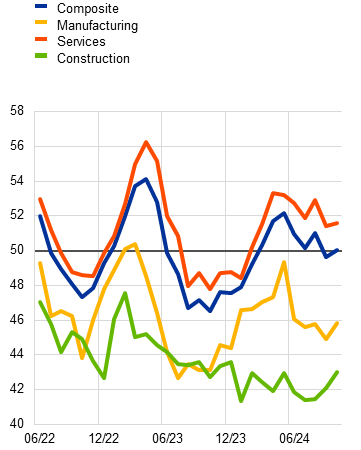
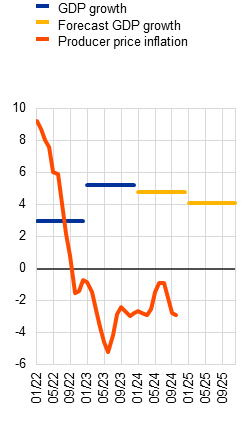
Economic Growth Forecasts

The European Commission has significantly cut its growth forecasts for the Eurozone as US trade policy creates economic disruption. The EU executive now expects the 20-member currency area's economy to grow only 0.9% in 2025—down from its previous estimate of 1.3%—and has reduced its 2026 GDP growth outlook to 1.4% from 1.6%.

Revised Growth Forecasts by Country

CountryPrevious 2025 Forecast (%)Revised 2025 Forecast (%)
Eurozone (Overall)1.30.9
Germany0.70.0
France0.80.6
Italy1.00.7

Source: European Commission Forecast, May 2025

Trade Tensions & Economic Impact: The EU's growth forecasts factor in a "significant" reduction in US-China trade and new US tariffs, including 10% "reciprocal" levies on most EU imports and 25% tariffs on EU steel, aluminum, and cars. Economy Commissioner Valdis Dombrovskis noted that while "the EU economy is demonstrating resilience amid high trade tensions," risks to the outlook remain "tilted to the downside." Germany is projected to flatline this year, while Ireland, Spain, and Greece are expected to outperform the Eurozone average. Inflation is forecast to reach the ECB's 2% target by mid-2025 before falling to 1.7% on average next year.

Key Vulnerabilities by Sector

Household Sector

Household debt-to-income ratios have declined, but debt service costs remain elevated for some. Risks are concentrated among low-income and highly indebted households.

Household Vulnerability Indicator
Household Vulnerability Indicator: The indicator shows that while household debt-to-income ratios have improved, some segments remain vulnerable to higher interest rates and inflation. Low-income and highly indebted households are most at risk of financial stress.

Corporate Sector

Corporate balance sheets are under pressure from high funding costs and weak growth, especially in commercial real estate and SMEs. Insolvencies are rising from low levels.

Corporate Insolvency Index
Corporate Insolvency Index: The index highlights a gradual rise in corporate insolvencies, particularly among SMEs and sectors sensitive to higher funding costs. While still below pre-pandemic levels, the trend warrants close monitoring.

Sovereign & Market Risks

Sovereign vulnerabilities are increasing, especially in high-debt countries. Market volatility has increased, with sharp but short-lived corrections in equity and bond markets.

Sovereign Debt and Market Volatility
Sovereign Debt and Market Volatility: The chart illustrates increased volatility in sovereign bond markets, especially in high-debt countries. Short-lived corrections have occurred, but underlying vulnerabilities persist and require ongoing attention.

Banking Sector

Euro area banks remain resilient, with strong capital and liquidity buffers. Asset quality is deteriorating slowly, mainly in CRE, SMEs, and consumer credit, but exposures are manageable in aggregate.

Capital Adequacy by Country Group

Source: European Banking Authority, Q4 2024 data
Capital Adequacy: Euro area banks maintain strong capital positions, with CET1 ratios well above regulatory requirements. This capital strength provides a buffer against potential losses from adverse macroeconomic or market shocks.

Non-Performing Loan Ratio Trends

NPLs as a percentage of total loans
Source: European Central Bank Consolidated Banking Statistics
Non-Performing Loan Ratio Trends: The NPL ratio for euro area banks remains near historical lows, reflecting strong asset quality and prudent lending standards. However, a gradual uptick is visible in sectors most exposed to higher interest rates and weaker growth, such as commercial real estate and SMEs. While overall risks are contained, close monitoring is warranted as macroeconomic conditions evolve.

Stress Test CET1 Ratio Impacts by Country Group

Baseline vs. Adverse Scenario CET1 Ratios (%)
Source: European Banking Authority 2024 EU-Wide Stress Test
Stress Test CET1 Ratio Impacts by Country Group: ECB stress tests indicate that euro area banks, on average, maintain robust capital buffers under adverse scenarios. However, the impact on Common Equity Tier 1 (CET1) ratios varies by country group, with banks in countries with higher sovereign and macroeconomic vulnerabilities experiencing larger declines. This underscores the importance of country-specific risk factors and the need for continued vigilance in monitoring capital adequacy across the euro area banking sector.

Liquidity Metrics by Bank Type

Source: European Central Bank Supervisory Statistics, Q4 2024
Liquidity Coverage: Banks’ liquidity coverage ratios remain comfortably above regulatory thresholds, supported by ample central bank reserves and stable funding sources. This positions banks to withstand short-term liquidity shocks.

European Banking Profitability Trends

Key performance indicators over time
Source: European Banking Federation, Banking Sector Performance Indicators
Profitability Trends: Bank profitability has improved, driven by higher net interest margins amid rising rates. However, increased funding costs and potential credit losses could weigh on profits going forward.

European Banking System Risk Assessment by Country

Risk scores from 0 (high risk) to 100 (low risk)
Source: European Financial Stability Institute composite scoring model, 2025
Country Risk Heatmap: Risk exposures vary across euro area countries, with higher vulnerabilities in countries facing elevated sovereign debt, weaker growth, or concentrated sectoral risks. The heatmap highlights areas for close monitoring.

Non-Bank Financial Sector

NBFIs face valuation, liquidity, and leverage risks, especially in investment funds and insurers. High concentration in equity holdings and increased exposure to US assets amplify vulnerabilities.

NBFI Liquidity and Leverage
NBFI Liquidity and Leverage: Non-bank financial institutions face heightened liquidity and leverage risks, particularly in investment funds and insurers. High concentration in equities and US assets amplifies potential vulnerabilities.

Climate & Emerging Risks

Climate change and transition risks are increasingly relevant for euro area financial stability. Physical and transition risks are sector-specific and evolving.

Evolution of Climate Risk Channels

Percentage of financial system exposure to each risk type. Source: Climate Finance Institute projections.
Climate Risk Overview: The chart summarizes the growing impact of climate-related risks on euro area financial stability. Both physical and transition risks are increasingly relevant for banks and non-banks alike.

Climate Risk Exposure by Economic Sector

Risk exposure scores from 0 (low) to 100 (high)
Source: Climate Finance Institute, Sectoral Climate Risk Assessment 2025
Sector Exposure to Climate Risk: This chart details sectoral exposures to climate-related risks, highlighting which industries are most vulnerable to transition and physical climate impacts.

Download Data

All charts and data from this report are available for download in multiple formats.

Further Resources

Related Risk Reports

ECB Financial Stability Review—2024
Current
Financial RiskNov 2024

ECB Financial Stability Review—2024

Official ECB assessment of euro area financial stability, risks, and resilience.

ECBEuro AreaSystemic Risk
Macroprudential Bulletin
Macroprudential2024

Macroprudential Bulletin

ECB bulletin on macroprudential policy, systemic risk, and regulatory developments.

ECBMacroprudentialPolicy
Climate Risk & Financial Stability
Environmental Risk2024

Climate Risk & Financial Stability

Analysis of climate-related risks to euro area financial stability.

ECBClimateTransition Risk